RSI (Relative Strength Index) Indicator – A Smart Tool for Online Trading on MT5 & Web Trading Platforms
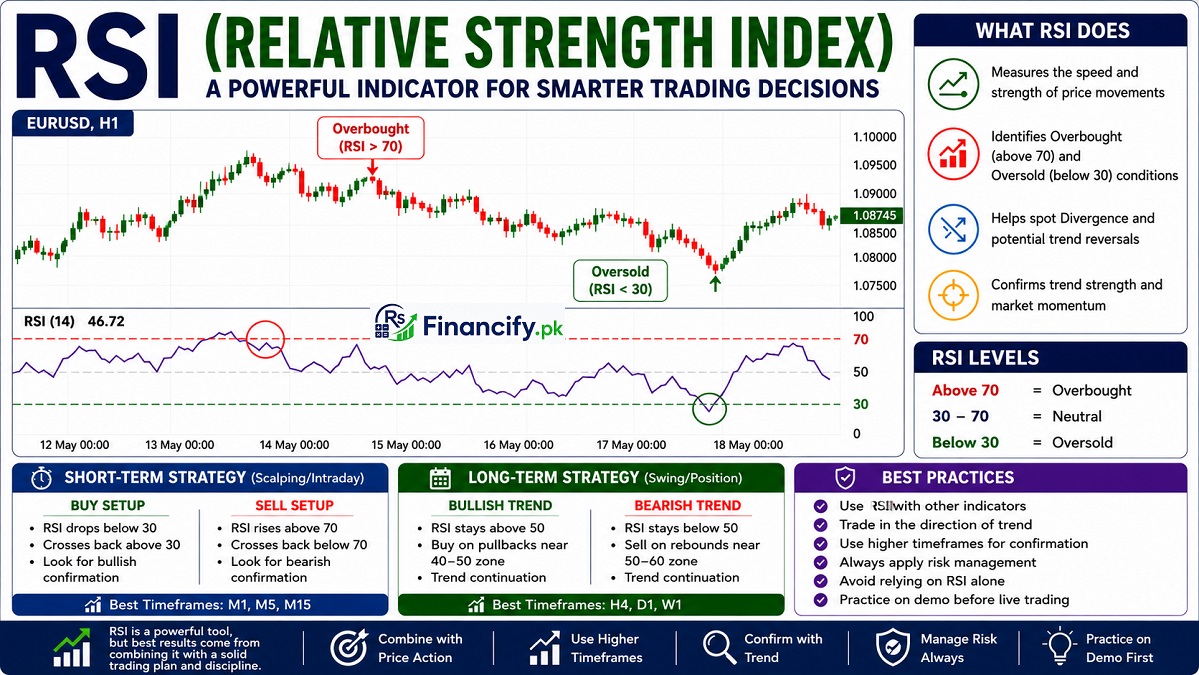
Technical indicators are essential for online trading. The most reliable and widely used momentum indicators are RSI (Relative Strength Index). RSI works irrespective of whether you are trading Forex, Gold, Indices, Stocks, or Commodities through MT5 or any web trading terminal. RSI gives traders the opportunity to gauge market momentum, determine when a market is overbought, and identify when a market is oversold.
What is RSI (Relative Strength Index)?
Relative Strength Index or RSI is a momentum oscillating indicator created by J. Welles Wilder Jr. RSI is a scale of 0 to 100 measuring the speed and magnitude of price changes.
The RSI indicator primarily answers the question if a price of a financial asset is:
- Overbought (overvalued)
- Oversold (undervalued)
The most popular setting of RSI is 14 periods which means that the indicator evaluates the last 14 candles or price periods.
How RSI Works
RSI = 100 – 100 / 1+RS
Where:
- RS = Average Gain ÷ Average Loss
- RSI can range from 0 - 100
Standard RSI Levels
- Above 70 → Market is usually overbought
- Below 30 → Market is usually oversold
- Around 50 → Momentum is neutral
These levels also help traders determine if a trend is likely to be continued or get reversed.
RSI Function in Trading
The RSI (Relative Strength Index) is an important online trading indicator that does multiple things:
1. Identifying Overbought Markets
RSI reading over 70 is indicative that buyers are most likely to push the price higher too quickly. This means traders should be ready for possible price corrections or bearish reversals and traders should begin to sell short.
2. Identifying Oversold Markets
RSI reading below 30 is indicative of strong selling pressure to which traders respond by anticipating the bullish rebound and traders should begin to buy long.
3. Confirming Trend Strength
RSI confirms strong or weak trends. Here are some clues to trends:
- RSI above 50 is bullish momentum.
- RSI below 50 is bearish momentum.
4. Detecting Divergence
Divergence is detected when price movement and RSI move in opposite directions of each other.
Here are some examples of Divergence:
- When price makes a new high, but RSI fails to make a new high, then you are in a possible bearish reversal.
- When price makes a new low, but RSI forms a higher low, then you are in a possible bullish reversal.
Detecting Divergence is the most powerful RSI signals that are used by professional traders.
RSI Reliability for Trading Decisions
RSI is a very reliable trading indicator (if used correctly) but no trading indicator is 100% correct.
Advantages of RSI
- Very simplistic
- Applicable to novices and experienced traders alike
- Compatible with all instruments & time frames
- Useful in analyzing price action
- Great indicator in trending markets
Limitations of RSI
- Can give misleading information when markets are in a strong trend
- An overbought market can remain overbought and thus price can continue to rise, and vice versa.
- Should always be used in conjunction with other market analysis techniques
More reliable when combined with:
- Support & Resistance analysis
- Moving Averages
- Trends
- Candlestick patterns
- Volume analysis
Best RSI Strategy for Short-Term Trading
Recommended Timeframes
- 1 Minute (M1)
- 5 Minutes (M5)
- 15 Minutes (M15)
Common Short-Term RSI Strategy
Buy Signal
- RSI indicator goes below 30
- RSI moves back above 30
- Price action has a bullish candle
Sell Signal
- RSI indicator goes above 70
- RSI then goes below 70
- Price action has a bullish candle
Suggested RSI Settings
- RSI 14 (standard use)
- RSI 7 or 9 for scalpers to get faster RSI signals
Risk Management
Trading Risk Short-term trading requires:
- Good stop-loss placement
- Good lot sizes
- They should not trade too frequently
Best RSI Strategy for Long-Term Trading
Long-term traders are typically looking for longer bigger profitable market moves and confirmations.
Recommended Timeframes
- 4 Hours (H4)
- Daily (D1)
- Weekly (W1)
Common Long-Term RSI Strategy
Bullish Trend Strategy
- RSI > 50
- Buy on pullbacks to RSI 40–50
- Hold longs
Bearish Trend Strategy
- RSI < 50
- Sell on rallies to RSI 50–60
Why Long-Term RSI is More Reliable
Higher Time frames RSI reduces market noise. Leveraging RSI aligned with larger time frame trend analysis is a common practice among professionals.
RSI on MT5 and Web Trading Platforms
RSI is mostly provided by Online Brokers on:
- MetaTrader-5 (MT5)
- Web Platforms
- Mobile Trading Apps
How to Add RSI on MT-5
- Open the Trading Chart:
- Select “Insert”
- Select “Indicators”
- Select “Oscillators”
- Find “Relative Strength Index (RSI)”
Personalize:
- RSI period
- Overbought and oversold
- Colors of the indicator
Tips for Using RSI Effectively
- Extend trading beyond RSI signals
- Trade with market direction
- Use higher time frames for alignment
- Use alongside price analysis
- Adhere to risk management policies
- Practice on demo first
SUMMARY
Whether you are using MT-5 (Meta-Trader 5) or a web trading platform, RSI is valuable for online trading. It increases the effectiveness of market analysis and enhances trading discipline.
For short-term trades, RSI pinpoints momentum shifts and reversals. For long-term trades, RSI confirms market trends and sets up stronger trades.
Though RSI is a great tool for spotting trades, patience, strategy, and effective risk management also make a successful trader. RSI is an indicator in a greater plan, and should not be a plan itself.

Rate Blog
Tap a star to rate this guide. Ratings are open for everyone and are counted immediately.